Adult Stem Cell Research
How adult stem cells maintain tissues is an important question in the context of cancer origins, potential regenerative therapies, and treatments in humans.
Background and Previous Research:
Unlike embryonic stem cells, which are tasked with the initial development of many cell types, adult stem cells are found in adult organisms and are typically responsible for replenishing nearby cell types. Intestinal lining and blood cells are examples of cell types with high turnover produced by adult stem cells in humans.
Our lab uses Drosophila ovarian Follicle Stem Cells (FSCs) as a model system to perform in vivo experiments, in order to better understand adult stem cell behavior. FSCs are advantageous as a model system as they have a similar organization as mammalian intestinal stem cells and have been studied for over 25 years.
We are currently investigating the development of FSCs, the external inputs that guide FSC behavior, and how these inputs regulate the cell cycle and proliferation of FSCs.
FSCs are epithelial stem cells, initially discovered for their ability to consistently produce Follicle Cells (FCs), which form a coat around developing eggs. Our research uncovered that FSCs additionally produce Escort Cells (ECs), non-dividing cells that support the earliest phases of egg development.
Egg development, also called oogenesis, begins in a structure called the germarium, found at the anterior end of an ovariole. Drosophila have two ovaries, each comprised of roughly 15 ovarioles. Germline stem cells (GSCs), another type of adult stem cell found in the anterior of the germarium, divide asymmetrically to produce germline cells that will eventually provide the body of eggs. These germ cells mature as they move in the posterior direction, and interact with FSCs in the middle of the germarium.
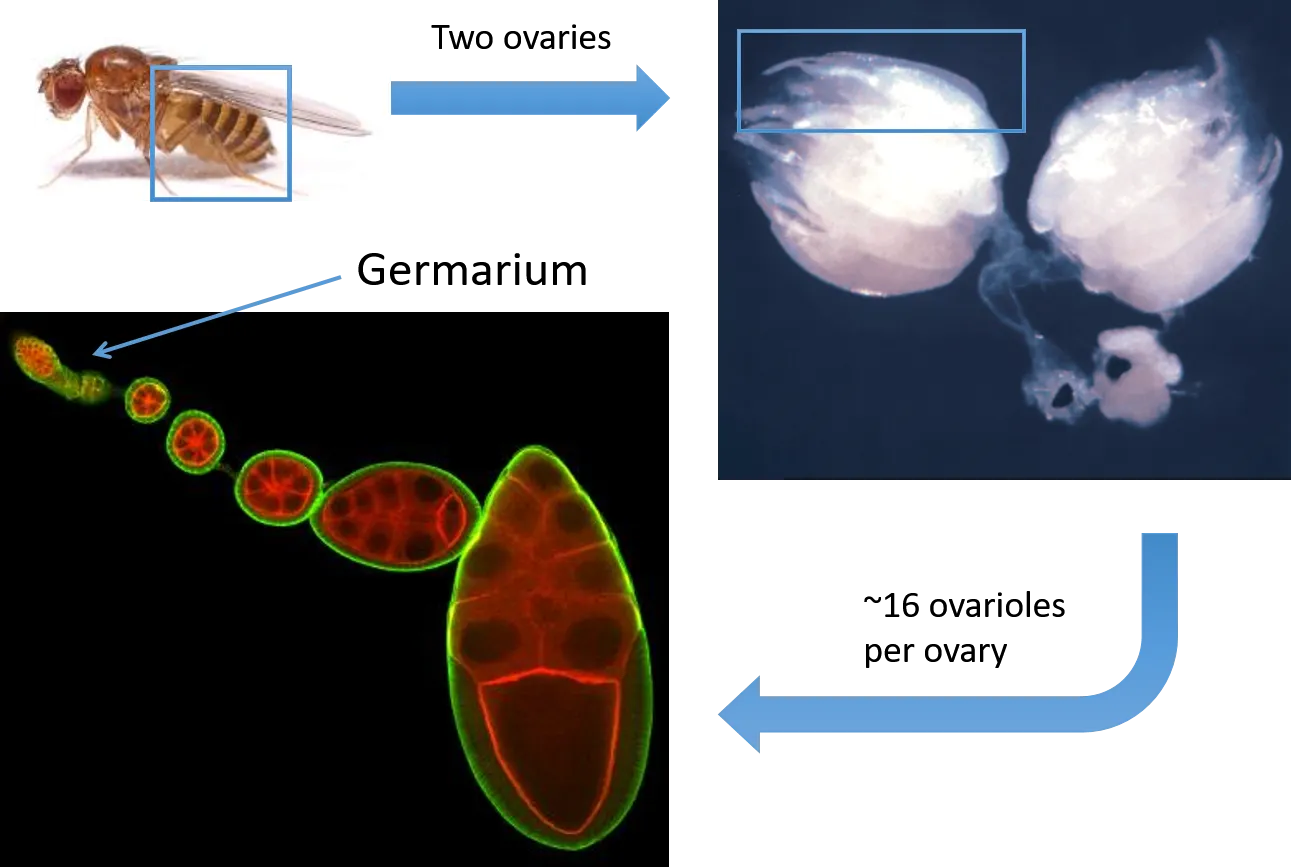
The Drosophila female has two ovaries, each of which is comprised of roughly 15 ovarioles. The germarium, at the anterior of the ovariole, houses two types of stem cells - Germline Stem Cells (GSCs) and Follicle Stem Cells (FSCs). Egg development progresses as cells migrate in the posterior direction.

A confocal image of a Drosophila ovariole. DAPI, in blue, labels cell nuclei, and Fas-3, an adhesion protein labelled in red, is used as a marker for FCs.
It was previously assumed that there were a small number of FSCs that were governed by single-cell asymmetry, in which an individual stem cell division produces exactly one stem cell and one daughter cell. However, extensive research in our lab showed that there are actually 14-16 FSCs per germarium and that they are governed by population asymmetry, where the overall rates of division and differentiation are regulated collectively, but individual FSC divisions occur stochastically. Population asymmetry is also observed in mammalian intestinal and skin stem cells; therefore, having a model system for population asymmetry is invaluable.
Single cell asymmetry means that each stem cell division produces one stem cell and one differentiated cell. Population asymmetry means that stem cells are maintained in the niche as a population, but the fate of individual stem cells is stochastic and subject to neutral competition.
Therefore, in a stem cell pool maintained by population asymmetry, individual stem cell divisions can produce two stem cells, one stem cell and one daughter, and even two daughter cells. Our research has shown that division and differentiation events are uncoupled; individual stem cells may therefore differentiate without dividing at all.
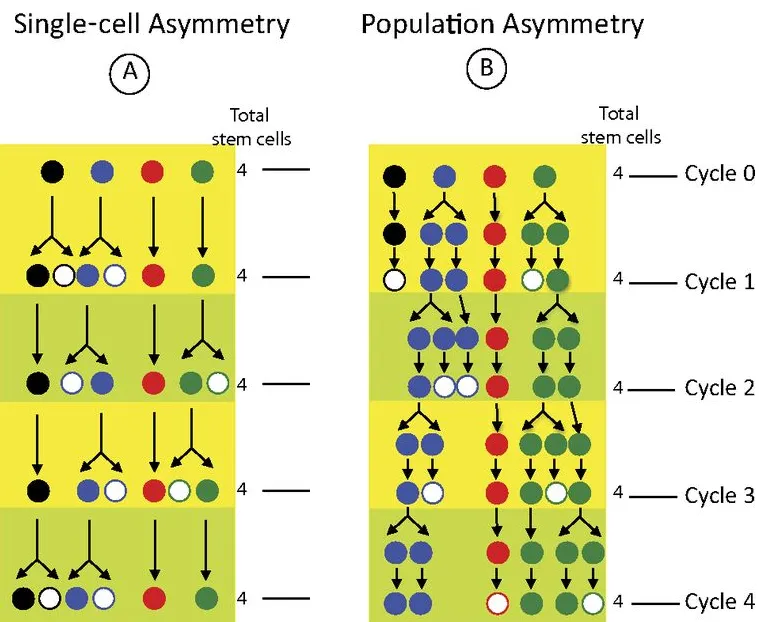
A diagram comparing single-cell and population asymmetry. In each, four stem cells (colored in circles) undergo four potential cycles of division and differentiation (conversion to white cells). In single-cell asymmetry, the same four colors remain after the four cycles; however, in the population asymmetry, the black and red lineages are lost to differentiation, allowing the blue and green lineages to expand their presence in the niche. This loss and gain is stochastic.
To test for population asymmetry, we labeled FSCs with a multi-color labeling system that allows for six unique color combinations. If FSCs were governed by single-cell asymmetry, we would expect there to be very little change in the average number of FSC lineage colors over time. However, a system governed by population asymmetry would show a decrease in colors over time, as a small number of stem cells would take over the niche. As seen in the images below, FSC lineages became homogeneous by 30d after multi-color label induction, evidence of population asymmetry.

Using a multicolor labeling system with six possible lineage colors, we confirmed the presence of population asymmetry by counting FSC lineages at 9d (top), 21d (middle), and 30d (bottom).
By labeling single cells and tracking their descendants, we can monitor the behavior of individual FSC lineages. We found that these lineages can vary with regard to the number of FSCs, the presence of daughter cells, and how recently those daughter cells were produced. The stochastic nature of individual FSC lineages is indicative of population asymmetry.
We have found that an FSC can differentiate at any time, independently of division. Moreover, division and differentiation can be regulated independently.
A consequence of this property is that faster dividing cells will outcompete their neighbors and take over the niche. This was measured in FSC clones with manipulated levels of proteins known to affect FSC proliferation rates. We observed a correlation between proliferation rate and FSC clone number.

Stem cells engineered to have slow division rates (yki, cycE, and cutlet) are lost from the niche over time, whereas cells with higher division rates (hpo, UAS-CycE, and pten) accumulate in the niche over time. In these experiments, EdU, a thymidine analog, is used to assay proliferation by labeling cells that are in S phase. The number of FSCs in the niche (red bar is 6d after lineages were initiated; green bar is 12d) correlates with the rate of EdU incorporation (blue bar). EdU is stained red in the images.
As discussed above, FSCs are maintained by population asymmetry and produce daughter cell types from posterior and anterior faces of the niche.
Within the FSC niche, we have found that properties of FSC behavior are heterogeneous based on location.
- FSCs are arranged in three A/P layers, in which roughly 8 FSCs occupy the posterior layer 1, 6 FSCs occupy layer 2, and 2 FSCs occupy the anterior layer 3.
- FSC division rate increases in the A/P direction, as 8.2% of layer 3, 20.0% of layer 2, and 33.4% of layer 1 FSCs incorporated EdU, a marker for S phase, in in vivo labeling experiments.
- Posterior FSCs directly give rise to FCs, and anterior FSCs give rise to ECs
- FSCs are radially mobile and can exchange layer positions
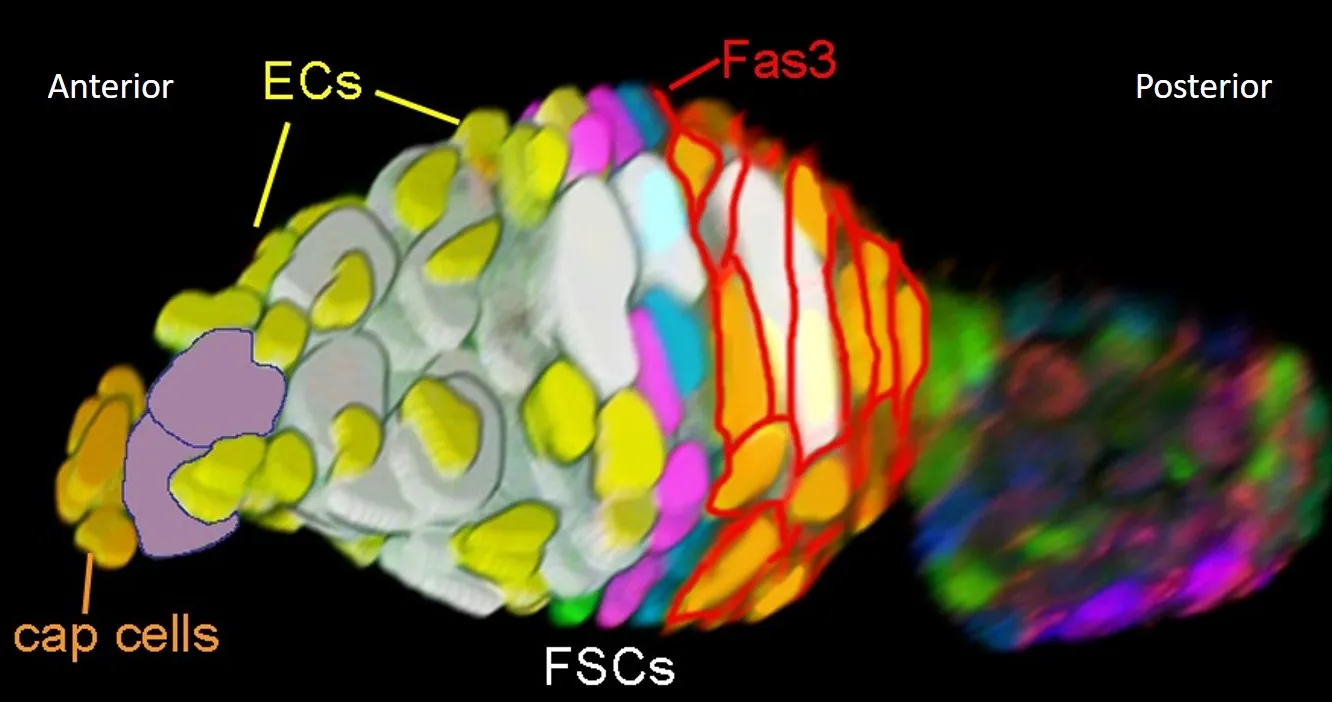
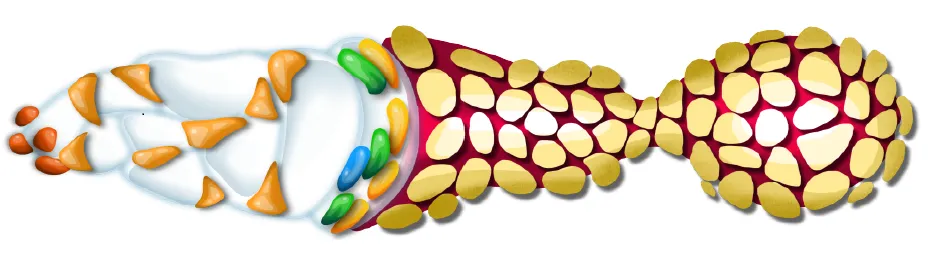
A 3D reconstruction of a germarium imaged via confocal microscopy, showing the relative locations of ECs, FSCs, and FCs (labeled with Fas3).
Numerous signals influencing FSCs have been identified, including Hedgehog, BMP, EGFR, integrin, and insulin pathways. We have found that Wnt and JAK-STAT signaling are critical, dose-dependent regulators of patterned FSC behavior.
The Wnt ligand is produced in cells at the anterior of the germarium and the JAK-STAT pathway ligand is produced in cells posterior to the FSC niche. The strength of each pathway is graded across the FSC region, contributing to the heterogeneity of FSCs within the three layers.
Both pathways exert an influence over FSC differentiation, location, and division rates. Wnt primarily affects A/P position and EC production, and JAK-STAT primarily affects division rates and FC production.

When JAK-STAT activity is eliminated via the stat mutation (left image), FSCs do not divide and are lost from the niche over time. When JAK-STAT activity is increased via elevated JAK (Hop) expression (right image) FSCs divide faster and take over the niche.

When Wnt activity is eliminated via the arr mutation, cells in an FSC lineage appear in the posterior layers and ECs are not produced.When Wnt activity is elevated via the axn mutation, cells in an FSC lineage appear in the anterior layers and EC region.
In all, the balance of signaling activity from Wnt and JAK-STAT regulates the population-wide rates of FSC division and differentiation, and appear to define the boundaries of the FSC niche.
Current Research:
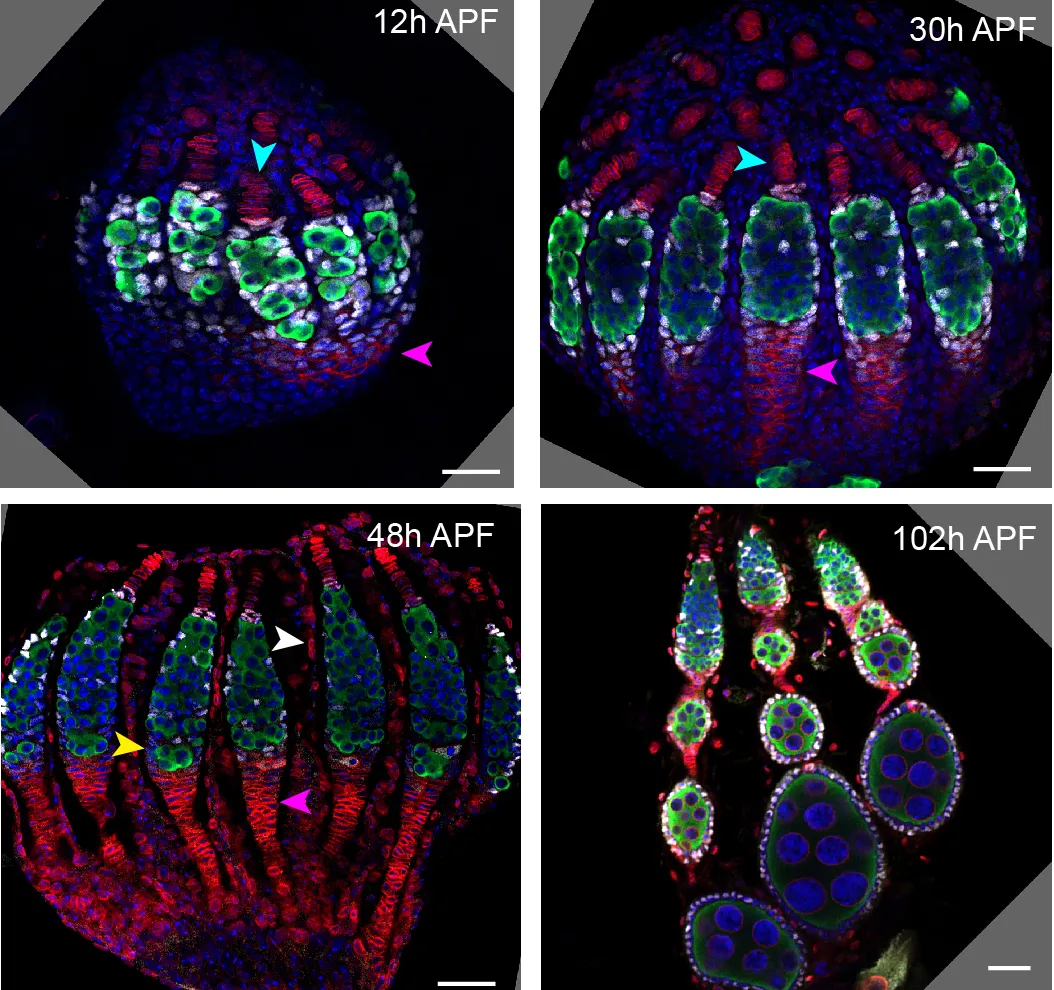
A timecourse of pupal ovary development. Times are after puparium formation (APF), which is when a larva stops moving and enters the pupal stage. Germline cells are stained for Vasa in green. Intermingled cells, which are the precursors to Escort cells, FSCs, and follicle cells, are stained for Traffic Jam in white. All nuclei are stained for DAPI in blue. The blue arrowheads show Terminal Filaments, stained with LaminC in red. The pink arrowheads show Fasciclin 3 expression, also stained in red, which marks cells that form the basal stalks.
Previous experiments have measured proliferation with EdU, which only labels cells in S phase. We are currently investigating how the entire cell cycle is regulated in FSCs. This involves the use of Fly FUCCI (fluorescence ubiquitination cell cycle indicator), a system that uses conjugate proteins (E2F-GFP and CycB-RFP) to label G0 and G1 phases in green, S phase in red, and G2 and M phases in both red and green.

A diagrammatic representation of how Fly-FUCCI uniquely labels phases of the cell cycle.
By expressing Fly-FUCCI, we can identify the distribution of FSCs and ECs in different phases of the cell cycle, and begin to examine how manipulations to signaling pathway activity may affect these distributions. We are also using live imaging with Fly-FUCCI to visualize cell cycle transitions and estimate the length of cell cycle in wildtype and mutant conditions.

An example of the Fly-FUCCI system producing differential GFP and RFP expression in FSCs and ECs.